NSE News - Latest Corporate Announcements

Sunday, May 16, 2010

Jayant Agro Value Buy?


Jayant Agro Oragnics
Current Market Price: 81.55
Market Cap: 122Cr
Free Float: 55Cr
Sales March 2010: 863.72Cr
PBIT March 2010: 27.23Cr
Interest March 2010: 12.05Cr
Profit Before Tax 2010: 15.18Cr
Tax: 7.09Cr
Net Profit 2010: 8.08Cr
ROCE March 2009: 19.62%
Debt Equity Ratio March 2009: 0.92
Long Term Debt Equity Ration March 2009: 0.63
The profits declared by Jayant Agro Organics is not that great and does give an impression of a fairly valued company in a low margin industry. But we need to dig a little deeper to get the real information about Jayant Agro Organics.. Lets start with the consolidated numbers  for Year ending March 2010:


Yes consolidated profits are double of standalone profits but before that I would first like to look at the percentage of public shareholding.(Point 1) It has decreased from 45.06% last year 2009 to 40.07% in 2010 thats a decrease of 4.99% in public shareholding.. Incidently SEBI has an upper limit to creeping acquisition by promoters of 5% every year and Jayant Agro Organics promoters have used up that limit completely.

Now lets look at the PBDIT numbers (Point2) on a standalone and consolidated basis. PBDIT numbers have increased from 29.70Cr Standalone to 41.04Cr (consolidated)  for year ending march 2010 an increase of 38.19% considering the fact that sales have increased from 863.72Cr to 887.17Cr for the same period an increase of 27.14%. So the subsidiary company has:
 Sales March 2010: 23.44Cr (887.17-863.72)
PBDIT March 2010: 11.34Cr (41.04-29.70)
That gives an operating profit margin of 48.38% for its subsidiary.. WOW!!.

Personally I feel the numbers are not really that good and what we are seeing is a supressed standalone numbers (to depress the stock price) and hence the consolidated numbers (Operating margins of subsidiary) are high. This has been done to allow the promoters to accumulate the stock when the prices are still low (as standalone profit numbers are low). The other reason is because the high value added subsidiary is expected to commence production only in March 2010.

Jayant Agro Organics is the largest listed Castor based speciality chemical company in India. India is the largest castor producing nation in the world with 60% of the world wide production of castor seeds. Consumption of castor is highest in european countries, USA and Japan.

Castor oil is a triglyceride with 90% of fatty acid chain is ricinoleic acid. Ricinoleic acid is a monosaturated, 18 carbon fatty acid and ricinoleic acid has a hydroxy functional group on the 12 carbon.


This functional group causes ricinoleic acid (and castor oil) to be unusually polar, and also allows chemical derivatization that is not practical with most other seed oils. It is this hydroxyl group which makes castor oil and ricinoleic acid valuable as chemical feedstocks.

Compared to other seed oils which lack the hydroxyl group, castor oil commands a higher price. As an example, in July 2007 Indian castor oil sold for about US$0.90 per kilogram (US$0.41 per pound)[3] while U.S. soybean, sunflower and canola oil sold for about US$0.30 per kilogram (US$0.14 per pound).[4]

Castor Oil and its Bio-derivatives is used as a raw material in the manufacture of Lubricants, Greases, Polyurethanes (Coatings Adhesives, Sealants Elastomers & Foam), High performance Polyamides[HPPA] (Nylon), Plastizers, Personal Care Products, Pharmaceuticals and Fragrances.

Castor Oil is a Natural Oil Polyol-There is no substitute in nature for its unique Biochemical structure. Modification of the Molecular Structure by dehydration yields a unique drying oil-that is superior to any other vegetable oil. Castor Oil Derivatives are unique to high performance greases and cannot be substituted. Castor Oil and Castor derivatives are Bio-Renewable, Biosustainable and where necessary Bio-Degradable.

Principally, Castor Oil & its bio-derivatives applications can be found in following industries:

Lubricants: Hydrogenated Castor Oil , 12 Hydroxy Stearic acid and Sebacic Acid are used in the manufacture of greases.

Polyurethanes: Polyester Polyols are used in the manufacture of polyurethane Coatings, Adhesives, Sealants, Elastomers and Flexible & Rigid Foams.

High Performance Polyamides (HPPA): Sebacic Acid and C10-Diamine are the building blocks for Nylon 6-10 and Nylon 10-10 . Sebacic Acid is available in Granular and Powder forms.

Pharmaceuticals: Castor Oil BP / USP / EP / DAB 10 grades are used in a range of pharmaceutical products.

Paints & Coatings: Dehydrated castor oil is a unique drying oil used in high gloss, non-yellowing paints Dehydrated Castor Oil Fatty Acids are used to make high solids alkyd, acrylic and epoxy ester resins for coating applications. Castor based reactive polyamides are used in high performance coatings.

Cosmetics: Special de-odorized castor oil, Hydrogenated Castor Oil, & ethoxylated derivatives are widely used in a range of cosmetics & toiletries. Undecylenic acid is used in anti-dandruff applications.

Plastic Polymer Rubber:  HCO is used in plastic master batches. Blown castor Oil is used as a plasticizer for synthetic rubbers. Nylon 11, a very important engineering polymer with a wide range of applications is made from Castor Oil.

Electronics & Telecommunications: Castor Oil BSS (COFSG) & electrical grade is used in the manufacture of capacitors used for electronic applications. Nylon 11 is used for sheathing of optic fibers in broadband networks.

Perfumery: Heptaldehyde & Undecylenic acid are used to make key aroma chemicals used in perfumes. An important aroma chemical is Undecylenic aldehyde used in many fragrances.

Agriculture: Undecylenic Acid, a derivative of Castor Oil is an important input for the growth of mushrooms. Castor Meal is used in organic farming.

Paper & Inks: Non reactive polyamides are used for lamination of paper. Castor derivatives are used in making special resin coatings used in various types of printing inks. Blown Castor Oils are utilized in many Bio-based Ink Formulations.

Country wise production numbers:


As can be seen India is the largest producer and EU, USA and Japan are the largest consumers.. Even China is now consuming more that its production capacity and is a net importer.
Let us look at the value addition that is happening.

Castor Seed - > Raw Castor Oil  ---------------126% price difference.
Castor Seed - > Pharma grade Castor oil ------------186% price difference
Castor Seed - > High Performance Polyamides (HPPA)------2122% price difference.

China is now the largest producer of HPPA in the world and infact imports castor oil from India. Indian manufacturers have been happy selling raw castor oil.

Jayant Agro Organics has two subsidiaries: Ihsedu Agro-Chem Private Limited and Ihsedu Speciality Chemicals Limited.
Ihsedu Agro-Chem Private Limited is located in Banaskantha which is one of the largest castor growing districts in Gujarat. Gujarat produces 71% , Rajasthan 16% of India's total castor seed production.

This plant has a crushing capacity of 350 MT oil / Day and also have solvent extraction plant. Jayant Agro Organics had acquired the crushing unit from Gujarat Agro Industries Corporation Limited.

Ihsedu Speciality Chemicals Limited is a speciality chemicals manufacturer with 24% stake with Mitsui and co. Ihsedu speciality chemicals limited is going to manufacturer HPPA product Sebacic Acid. The recent March 2010 result has disclosed that "Ihsedu Speciality Chemicals Pvt limited a subsidiary of the company has commenced production with effect from March 27,2010"

So what we have happening in Jayant Agro is:
1. Company has backward integrated by acquiring the seed crushing unit from Gujarat Agro Industries Corporation Limited in the largest castor growing district in Gujarat. Jayant Agro has increased capacity of the unit and has also installed a solvent extraction plant (which helps in extracting more oil from the Castor seeds) This step has helped Jayant Agro to consolidate its hold on raw material (castor seeds)
2. Company has forward integrated and tied up with Mitsui of Japan to manufacture high value added product sebacic acid which is a HPPA product and has a high profit margin (2122% price difference between castor seed and final HPPA product Sebacic acid)
3. Jayant Agro Organics had a preferential capital of 3Cr which has been paid off and additional equity capital has been issued 1,110,000 shares at Rs 60 per share to promoters. Equity capital has increased to 7.5Cr from 6.95Cr
4. Promoters have bought in the past 12 months 4.99% of equity from the market reducing the available traded shares by 9,45,097.

Conclusion: Jayant Agro is a strong buy for the long term and is a multibagger for sure. BITOR (Jayant Oil) a private castor oil company run by Kapadia's (different promoters) was the largest player in castor oil in India till 2004. With the acquisition of seed crushing capacity in the heart of the castor produucing region Jayant Agro has become the largest player. BITOR a private company had a private placement of shares and 23% stake was valued at 300Cr giving BITOR a market capitalization of 1304Cr. (link)Jayant Agro with revenues of 800Cr+ is valued in the market at 122Cr..Jayant is at the begining of its journey. With the commencement of production by its special chemicals division of sebacic acid we will see the consolidated numbers sky rocket..

Jayant Agro due to its strong leadership position and relatively cheap valuation is a Best Value BUY recommendation along  with Gujarat Ambuja Exports.

Thursday, May 13, 2010

Short Term Trading Call: Sell NIFTY 5100 PUT at 78.50

Here is a short term trading call.
Recommendation: Sell NIFTY 5100 PUT at CMP: 78.50 2 lots

Investment amount : 55,000
Buy NIFTY 5100 Put back at Rs 5 ..2 lots Buy date: anytime between May 13,2010 and May 27,2010 when the strike price is reached ie Rs5/=

Difference: 73/= Profit 7,300 on investment of 55,000 for next 15 days: Returns is: 13.27% in 2 weeks.

PN: This is a short term trading call. Since this is a naked short ..there is a possibility of total loss of capital 55,000. This is a free recommendation please do your own deep dive. The author is not responsible for the loss of capital (which is possible) Please do your own deep dive before investing. Comments are welcome!! ..Questions will NOT be entertained.

=happy investing

Saturday, May 08, 2010

Superhouse: Value Buy??


Superhouse
CMP: 50.35
Market Cap: 55.51Cr
Free Float: 27Cr
Debt: 88.70Cr
Sales Year 2009: 344.45Cr
Operating Profit: 30.05Cr
Taxes: 5.68Cr
Net Profit: 7.57Cr
ROCE: 12.73%
Debt Equity: 0.92
Long Term Debt Equity: 0.36
Divident: Rs 1.20
Divident Yield: 2.38%

Company Website: http://www.superhousegroup.com/
Superhouse is an established firm dealing in production of finished leather, leather products and textile garments. It is also established as the largest manufacturer of riding products such as breeches and riding shoes. It has 15 manufacturing units located in agra, kanpur, noida and unnao. It is an approved vendor for global brands such as Walmart, filanto, Carrefour , Metro MGB Group, Auchan, Andre, Shoe Fayre, Hudson Bay, Heckel Securite, Secura.

It also has its own brand of shoes Allen Cooper (Mens Shoes) and Double Duty (Safety Shoes)


Company results in recent quarters has been improving.. the stock also seems to be trending up.
The promoters have been increasing their shareholding in the company:
March 2006: 37.03% March 2007: 41.83%,  March 2008: 44.84%,  March 2009: 49.55%, March 2010: 54.50% Most of the increase in shareholding has happened through preferential allotment and amalgamation of private companies in the same line of business.


Conclusion: Company looks all set to deliver better results in the future. It is also entering into the indian retail segment. Margin expansion can be seen for 12 trailing months as compared to last year. Presence of privately held companies in the same line of business exist which could result in diversion of profits but a lot of private companies have been amalgamated which shows the intent of the promoters to concentrate business in Superhouse limited. An initial investment can be considered keeping the attractive valuation in mind. Also the stock is not yet discovered so we will get a finder's fees.. This is a long term play and any investment should be considered keeping at a minimum 1-2 year horizon or more.

Wednesday, April 28, 2010

GAEL Quaterly March 2010, Annual Results March 2010


Gujarat Ambuja Exports just reported its March 2010 Quaterly Income statement.
We will analyse the same and see if we can add any value to the information available.

Point 1. Profit before depreciation interest has improved significantly. On a quaterly basis its an improvement of 9.65% (965 basis points) on a yearly numbers we can clearly see that the company has made significant improvement in operating margins 2.21% .. yes its less than the unbelieveably high 9.65% but we must understand that March 2009 quaterly results were badly impacted due to the financial collapse that occured worldwide in early part of 2009.

Point 2. Depreciation figures are also inline though the March 2010 quaterly numbers are a low 1.58% .. the yearly figures are infact slightly higher at 2.39% from last year's figures.. So the profits are not being doctored on the positive or on the negative by reducing or increasing depreciation.

Point 3. Interest payments have reduced modestly from 0.69% of sales to 0.60% of sales.. so no major changes and the reduction in interest as compared to sales is a positive for the company.

Point 4. Tax expenses have increased sharply on a quaterly basis due to losses reported in march 2009 quarter. On a yearly basis the tax payments have increased modestly by 33 basis points (0.33%). Though tax payments increase would result in reduced net profit.. it indicates that the revenue numbers are true profits.. a sharp increase in profits without an increase in tax payout could mean the results are being fudged.

Point 5. Net Profit margins for the period has increased .. and matched the annual Operating profit margin improvement.

Let us also look at the segment results available


Point 1: If you see the profit margin of the various segments.
 - Windmill division - 60.11%
 - Maize Processing Division - 12.15%
 - Other Agro Processing Division - 5.18%
 - CottonYarn Division - 1.81%
Windmill division has the largest profit margin and 2nd largest profit margin is in the Maize processing divisio with 12.15%. Other Agro Processing division comes a distant 3rd with 5.18% and last of all is the Cotton yarn division with 1.81%

Point 2: Maize processing division margins have improved significantly over the past year from 7.34% to 12.15% in March 2010. Other divisions have not seen much change in profit margins as compared to last year.

Point 3. Maize processing division sales as a percentage of overall company sales/revenues has increased in march 2010 to 23.94% from 13.47%. an increase of 10.47%
At the same time the "Other Agro processing division" segment revenues as a percentage of overall company revenues has fallen by 12.24%

The segment revenues show us that the Maize processing division has been improving its margins and also is taking a larger share of GAEL annual revenues.

Company has had an overall increase in its operating profit margins of 2.21%. Margin expansion has happened as revenues of GAEL have shifted to better margin "Maize processing division". The poor results base of March 2009 (due to worldwide financial crisis in 2009 which impacted march 2009 results) also played a part in the net profit jump of 109.04%.

The company valuations are as follows:
CMP: 22.15
Market Cap: 306.45Cr
Sales March 2010: 1410.60Cr
Profit Before Depreciation,Interest and taxes : 111.05Cr
Depreciation: 33.76Cr
Taxes: 23.28Cr
Net Profit: 49.28Cr
EPS: 3.56

Conclusion: GAEL is still grossly undervalued. We can expect the company to announce another 40 paisa divident in 2nd half 2010 taking the total divident payout for 12 months to 80 paisa per share. Divident yield: 3.61%. lower most target Market Cap of GAEL is 492.8Cr (Target Share price:  35.6 per share)


Please note this is the lower most target level for GAEL stock. we can expect GAEL stock price to do much better as revenues and margins for maize processing division is increasing. With proper set of positive news flow and increased investor participation GAEL can reach its ideal stock price of 100+ .

Saturday, April 24, 2010

Gujarat Ambuja Exports: What is the ideal stock price for GAEL


Gujarat Ambuja Exports (GAEL) has been on a tear lately..
Closing Price: April 19,2010: Rs 16.40
Closing Price: April 23,2010: Rs 26.70
Thats a rise of 62.8% in 4 days. Infact on April 23,2010 the stock was on circuit.
NSE : 31,058 pending buy orders at 26.90
BSE : 61,513 pending buy orders out of which 1000 buy orders at 26.80.

The top question in our minds is:
1. What is the ideal sell price for GAEL stock that we own?

Let us step back in time and look at the buyback scheme that was launched in April 4,2007 and the buyback scheme (link) closed on Jan 15 2008
April 4,2007 Closing price of GAEL stock: 26
Jan 15,2008 Closing price of GAEL stock: 83.45


GAEL had started the buyback with the intention of buying back equity worth 26.25Cr at a maximum price of Rs 38 per share ie it had a mandate to buyback 69,07,894 shares (assuming the buyback happened at the highest price of 38 per share)

The buyback was successfull in buying only 9,66,615 equity shares at an average price of 34.26 only 13.99% of the mandated buyback amount. During the buyback period the stock moved from 26 to 83.45

Now ideally a company of GAEL stature should be selling at one times sale.
Enterprise Value = 1 times Sales
March 2009 Sales: 1610.91Cr
Current Enterprise Value: Market Cap + Debt -Cash-Cash equivalents
Current (CMP: 26.70) GAEL Enterprise Value: 369.4Cr(Market Cap)+90.32(Debt)-11.69(Cash)-26.21(Cash Equivalents) =  421.82Cr

To have an Enterprise Value equal to 1 times Sale (1610.91Cr) the Market Price should be: 1558.49Cr that would translate to stock price of  Rs 112.64. So the Ideal sell price for GAEL stock is: 112.64.

The stock however could face stiff resistance around its 52 week high of 36.20and its Jan 15,2007 closing price of Rs 83.45
==========================
Conclusion
I can fully understand that these target prices (112.64 and 83.45) are a tall order. Most likely the stock would be out of our hands much before these numbers. Having said that 38-40 levels is given for the stock and one can confidently target 38-40 levels in 12 months time frame (hopefully sooner). Levels of 83 and 112 are for very long term players who are comfortable with GAEL's management and business model.

Tuesday, April 20, 2010

IFB Agro: Value Investing


March 21,2010: IFB Agro: Value Buy
April 20,2010: IFB Agro: 20% rise ..What next?

IFB Agro: 20% rise..What Next?


IFB Agro industries was recommended as an investment on March 21,2010 at a price of 80.55
Today IFB Agro traded at 98.75 (up 19.99% for the day) we review the investment once again and estimate what should be our strategy going forward.

1. Price movement chart: This clearly shows that the company is on an uptrend and support is being provided by the 50Day Moving Average. Any investment can be considered at the 50Day moving avg (around 80 levels)

2. Performance Chart: This shows that there is a sharp increase in profitability though profitability varies from quarter to quarter which is a big negative for the stock and shows inconsistencies.

3. Index Comparison: IFB Agro is moving along with the index which does not provide us with any insight infact the stock is performing at the same levels.

4. Shareholding Charts: Shareholding charts show that the promoter shareholding has increased which was already specified in the initial investment discussion.

Conclusion: Company valuations are still cheap
CMP: 98.75
Market Cap: 79.07Cr
Sales March TTM (Twelve Trailing Months): 298.4Cr

Gross Profit TTM: 24.4Cr
Interest TTM: 1.66Cr
Taxes TTM: 4.77Cr
Net Profit TTM: 9.36Cr
Debt March 2009: 12.34Cr
================================
Ideal valuation would be atleast 1 times sales ie 298Cr. The company results are still very shaky and we need to see consistent profitability every quarter. Strategy can be two fold.

Strategy 1(Active trading): Sell on rise and buy close to 50Day moving avg.
Strategy 2: Buy close to 50Day moving avg and hold for long term to see value unlocking.

Note: These are my personal views and not any recommendation for investment. Please do your own deep dive before making any investment decision. Also note that IFB agro does not give any dividents which means your investments do not earn any returns while you wait for stock price appreciation. There also seems to be hostile investors in IFB Agro holding more than 10% shares in the company.

Friday, April 16, 2010

Gujarat Ambuja Exports: Sharebuyback Jan 15,2008 Avg Price 34.26


Here is the official communication to Bombay Stock Exchange by the company for the share buyback which was closed on Jan 15,2008 the Average buyback price was 34.26 no of shares bought: 9,66,615 Total money used for buyback: 3.3Cr.

As mentioned this was done in preperation for the sharply higher expected revenues from the maize plant setup in uttarachal. The stock during the buyback did reach a high of 104.6 per share on Jan 2,2008.

If we further read the complete document the high price for buyback was set at 38 per share and the amount of money available for buyback was 26.25Cr.
It is a SEBI Order that buyback can be done with free reserves only and only 10% of the free reserves can be used for share buyback.
Considering that 26.25Cr was the kitty for buyback we can safely assume the free reserves with the company in 2007 was atleast 262.5Cr. Right now the market cap of GAEL is 235.2Cr (CMP:17/-)

So folks Right now GAEL is dirt cheap .. I hope you all will pass on some profits back to me (Virtually!!)

Here is the snapshot of the buyback that was done at avg price of 34.26


 The stock right now is languishing becuase of supply side issues. Quantum reduced their holding of GAEL stock
BSE 1,05,000 shares sold

NSE: 1,79,000 shares sold

They have sold almost 2% stake from 2007 till date:
Stake June 26,2007: 7,040,841
Stake March 8,2010: 2,815,802

Right now Shareholding in GAEL is as follows:
Reliance Growth Fund: 4.26% 5,888,660
Quantum M Ltd: 2.65% - 3,669,339


Conclusion: Buy ..Buy.. Buy.. GAEL

Thursday, April 15, 2010

Pitti Lamination: Positive news in Moneycontrol


Ashish Chugh on April 5,2010 has recommended a buy on Pitti laminations citing improved margins.
On 5th April 2010 Pitti closed at a price of Rs 43.95. We had first recommended Pitti Laminations at a price of Rs 34 on December 2009 and improved margins were reported on Feb1,2010 when Pitti lamination price was Rs36.8..
With mainline news companies picking up the stock the stock is poised for further rise.. A target of 1 times sales is a good conservative target for a company in infrastructure,power category. 12 to 24 months time horizon is recommended.

Here is the link to the article in moneycontrol (Link)

Wednesday, April 14, 2010

Gujarat Ambuja Exports : Review


Gujarat Ambuja Exports (GAEL) was recommended first on June 01,2009 at a price of Rs 28.70 per share.
GAEL was again recommended as the "Best Value Buy" at a price of Rs 23 per share.

This review of the company is being done when the current market price of GAEL stock is Rs 17.50 per share a fall of 39.02% from 28.70 and a fall of 23.9% from Rs 23.  A fall of this magnitude definitely questions the rationality of the initial investment decision. more so because from 17.50 to reach 28.70 we need an appreciation of not 39% but 64%

That is precisely why Warren Buffet says:
Rule No 1 of Investing: Do not loose money
Rule No 2 of Investing: Do not forget Rule No 1.

As an investor we are at crossroads:

1. "Buy" as this is an opportunity in disguise
2. "Sell" the fundamentals have changed for the worse and company is going to dumps.
3. "Hold" company needs some time to get its act together and will recover to give us good returns on investment

Let us look at the 10 years balance sheet:


Income statement for past 10 years


Cash Flows for 10 years:


Financial Ratios for the past 5 years


The Financial ratios are a good place to start with as they take into consideration the balance sheet, income statement and the cash flow statement to deliver us the the data in terms of ratio's

Return on Capital Employed (ROCE): 15.61% (March 2009) This should be higher than the borrowing rate.

Debt Equity Ratio: 0.30
Long Term Debt Equity ratio: 0.05
The debt equity ratio has fluctuated from a high of 1.43 to a low of 0.30 (past 5 years). Long term debt has been relatively stable never rising above 0.09 in the past 5 years.  As  per my understanding this basically shows that the company has been taking short term debt for raw materials stocking
- Avg. raw material holding 74.73 when Debt Equity was: 1.43.
- Avg. raw material holding 34.66 when Debt Equity was: 0.30

No of Days of Working Capital: 25.16 (March 2009) Tight working capital management helps improve cash flows and profitability.

Another important activity which will provide us a better idea of the changes happening within is to look at the segmented results.


If we look at the Maize processing division revenues and results for year ended March 2009 and compare it with the results of Agro processing division for the same year we can see that the profit margins are higher for Maize processing division:
March 2009 Maize processing division revenues/results: 2228.74/172.97 = 7.76%
March 2009 Other Agro processing revenues/results: 12120.73/721.79 =  5.95%

Looking at 3 Quarters for the current financial year ending March 2010:
Maize processing division revenues/results: 2430.55/248.73 = 10.23%
Other Agro processing div. revenues/results: 6740.88/264.01 = 3.91%

What we can observe is that GAEL revenue generation is moving from the low margin "Other Agro processing division" to higher margin "Maize processing division".
This development is however not having a positive impact on the bottomline due to the sharp fall in the revenues of "Other Agro processing division" .

So the maize processing division margins are improving but the maize processing division earnings are not sufficient to compensate for the fall in earnings of "Other Agro processing division"

Notes on Account: The following notes on account for the quarter ending December 2009(link):
The forward exchange contracts (shortterm & longterm) outstanding at the quarter end have been marked to market and has been adjusted to hedge reserve as per the accounting policy followed by the company. The balance in hedge reserve at the quarter end December 2009 is 841.88 lacs as compared to 717.82 lacs at quarter end September 2009 and Rs 7357.32 lacs at year end March 2009.

The financial turmoil in the global markets resulted in huge forex and derivative trading losses. Since the forward contracts are to protect the revenues from dollar rupee fluctuations the true nature of losses can be determined only when the actual settlement of the contract (due to high volatility in rupee-dollar exchange rate) The company had hedge reserves of close to 73.57Cr at the end of march 2009 which according to the latest filing of Dec 2009 is down to 8.41Cr


Promoter buying stock from the open market:
Promoters have been buying stock from the open market:
Jan 2009 to Dec 2009: 1,98,256 shares.
Jan 2010 till date: 1,87,075 shares.

Conclusion:
- The company has increased production capacity of value added Maize products in year 2007-2008.
- In Anticipation of increased profitability GAEL did a stock buyback of 966,615 shares at an average price of Rs 34.5 per share. (Max buyback price set to Rs 38/= per share)
- The financial crisis of 2008-2009 impacted GAEL in a negative sense and resulted in forex hedging potential losses of close to 73.57Cr
- GAEL Maize products division results have been improving and its share of GAEL's bottomline is increasing. we however see a drop in "Other  Agro processing division" revenues and sales.
- Promoters have been increasing their stake in GAEL as the stock languishes close to its 4 years lows (link)

I would suggest a "Strong Buy" at these levels. With a return to normal operations we can easily expect a 100% return from these levels in 12-24 months timeframe.  Long term the stock can be a multibagger in the making for a patient investor. Exchange rate volatility though still very much in play, exchange volatility is a function external to the companies control and assume GAEL has learnt from the crisis and better planning will be done for the future.

New capacity additions (Maize division) is operational and a return to normal operations (Other Agro division) can easily see GAEL deliver better results. Promoter buying of company stock from the open market and previous attempts by the management (2007) to decrease equity by share buyback means the company is valued atleast above Rs 38 per share (max buyback price as per buyback agreement)


Monday, March 29, 2010

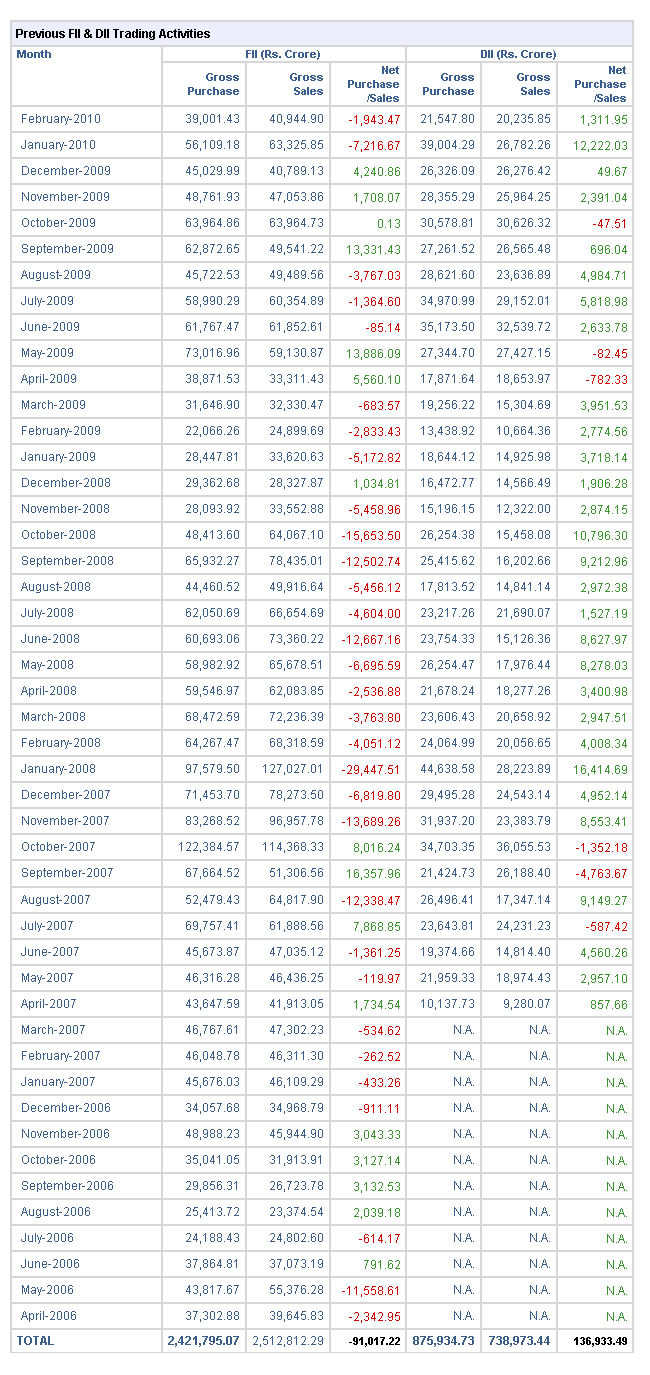
FII & DII Investment Activity


Sunday, March 21, 2010

IFB Agro: Value Buy


Financials:
Market Cap: 64.5Cr
Current Market Price: 80.55
Sales March TTM (Twelve Trailing Months): 298.4Cr
Gross Profit TTM: 24.4Cr
Interest TTM: 1.66Cr
Taxes TTM: 4.77Cr
Net Profit TTM: 9.36Cr
Debt March 2009: 12.34Cr
Cash Flow from Operating Activities March 2009: 26.13Cr
Return on Capital Employed March 2009: 28.35%
Promoter shareholding: 55.20%
Divident: No divident payout in past

Overview: IFB Agro is part of the IFB group which has interest in consumer durables. IFB Washing machines, Microwave ovens.
IFB Agro is part of the IFB group with 2 divisions: 1. Alcohol & 2. Marine Food.

Alcohol division has a grain based (60,000 liters per day) and Molasses based (60,000 liters per day) distillery. The grain based  distillery has been recently setup (2009) and has captive power and also confirms to zero discharge norms. CO2 gas generated from the distillery is being processed to produce food grade and industrial grade CO2 and Dry Ice. Molasses based distillery has been running below capacity due to high volatility in price of molasses. Company produces country and IMFL (Indian Made Foreign Liquor).

Marine Division: Marine division is mainly exporting Prawns to USA, Europe, Japan, Australia & South Africa. The marine exports business suffered a setback as export license was cancelled/expired.
The marine division is also selling ready to cook prawns "IFB Royal Prawns" in metro cities (Delhi, Mumbai, Kolkota, Hyderabad, Bangalore)

10 year Performance history:


Conclusion:
Promoters have recently given a rights issue increasing equity capital from 7.71Cr to 8.01Cr
The rights issue was done to promoters only at a price of: 67/= per share. As can be seen the debt has reduced substancially and ROCE is also rising sharply. Company is turning more professional with Emloyee Stock options being issued. The fact that Marine export license got cancelled/expired does raise questions on management quality.

IFB agro with a market cap of just 64.5Cr, Debt 12.34Cr, Sales of 300Cr, Gross Profit of 24.4Cr & ROCE of 28.35% looks to be a value investment at these levels. Once can have a short term (1 year)  price target of  97Cr (Market price of 120/= per share) long term as the company turns investor friendly we can expect Market Cap of close to 1 times sales. The only fact that brings down the investment quaity of IFB Agro is... No divident payout policy of the promoters.

Tuesday, February 02, 2010

Pitti Laminations


August 24,2011: Pitti Laminations: Time to Dip in
Feb 21,2011: Pitti Laminations: Dec 2010: Result Review
Sept 10,2010: Pitti Laminations: June 2010: Result Review
June 05,2010: Pitti Laminations: March 2010: Result Review
April 15,2010: Pitti Laminations: Positive news flow in Moneycontrol
Feb 01,2010: Pitti Laminations: Dec 2009 Qtrly Result Review
Dec 29,2009: Pitti Laminations: Deep Discount: Indirect Power Play
Annual Report Pitti Laminations March 2009
Annual Report Pitti Laminations March 2010
Annual Report Pitti Laminations March 2011

Pitti Laminations: Quaterly Results Dec 2009 Review


Pitti Laminations has come out with its Dec 2009 Quaterly results.
The results on the face of it look to be poor here some numbers:
===============================
Gross Sales Dec 2009 (Dec 2008): 3935.56 (7571.77)- Down 48%
Profit From Operations : 496.58 (538.03)   - Down 7.7%
Interest : 283.71 (312.55) - Down 9.2%
Exceptional Items : 560.16 (0.00) - UP by 560.16 lacs (last year NIL)
Profit Before Tax: -ve 347.29 (225.48) - Down from profit to Loss
Taxes: -ve 2.37 (108.61) - Down due to -ve PBT
Net Profit: -ve 344.92 (116.87) Down from profit to Loss
===============================
Well it looks like a sea of RED and it truly is. One however has to do some more digging and we will see some new and interesting information which will help us get into the stock at a deep discount!!

Lets look at the numbers from a different angle.

1. Company's expenses as percentage of sales has dropped 5.85% from 92.73% (Dec 2008) to 86.88%(Dec 2009) this has resulted in Profit from Operations before Other Income, Interest and Expenditure to sharply increase from 7.27% (Dec 2008) to 13.12% (Dec 2009). This incredible feat has been performed even when the topline has decreased by 48%. This is a clear indication that the forward integration has been successful and value added products are directly improving the operating margins of the business.(my take)

2. Interest payments have jumped 3.26% from 4.23% (dec 2008) to 7.49% (Dec 2009) also the nine month numbers also show  a similar increase. If we however look at the actual numbers (in blue)we can see that the interest payments have reduced from 312.55 lacs (Dec 2008) to 283.71 lacs (Dec 2009) the sales (topline) numbers have skewed the ratio's.
- Another important development which helps me conclude that interest payments are not destroying the companies valuations is that the promoters have successfully got their pledged shares back. The pledged shares were 24,48,356 (Dec 2008) and now stand at 12,58,356 thats a return of 11,90,000 a reduction of 48% in pledged securities. (compay announcements to BSE also confirm this payback of debt)

3. Exceptional Items increased to 14.8%(Dec 2009) of sales from 0% (Dec 2008). This is truly the main ingredient of the smoke screen responsible for depicting a poor performance by Pitti Laminations. The management has provided further explanation of the exceptional items as follows:
- "A seperate agreement has been entered into with GE agreeing to bear the cost relating to Engineering analysis for repair procedures, actual repairs and other associated costs for an aggregate sum of USD $1.2 million equivalent to 560.16 lacs, the liability of which has been recognised as an exceptional item of expense in the financial results of Q3"
- "The company is finalising a fresh agreement with General Electric Company (GE) for sale of its products for an aggregate value of $36 million USD commencing from January 2010"

The 560.16 lacs expense reported as an exceptional item which means it should be one-off expense and company management has also clarified that it is expected that Pitti Laminations will be given future orders worth 36 million USD (168 Cr) having said that I must confess large corporations like GE can easily arm twist small companies such as Pitti Laminations and I hope the exceptional expense remains an exceptional item and does not become the "rule" (keep a watch for this in the future)

Conclusion: Pitti Laminations is definitely a very good buy at these valuations as operating margins have improved (and the stock has dropped!!). Its cliente list in India and abroad is pretty impressive. Operating margins are also looking healthy and expect the company to easily quote at one times sales 250Cr (when operators enter the stock !!  Psst .. Psst Operator !! Hello Hello!!..)


GE Exceptional Item is good and bad. Good if this provides value addition to Pitti's ability to deliver better products. Bad if this is plain arm twisting by big brother and a handme down of expenses for doing business with GE and could be a regular expense item.. however I would still place my bets with Pitti Management and recommend it as a good value buy at these levels to be a multibagger.

Sunday, January 31, 2010

Camlin Fine Chemicals (CFC) Limited


Jan 30,2010: CFC: Review Dec 2009 Quaterly Results
Dec 24,2009: CFC: Long Term Value.
Company Website: CamlinFineChem.com

Camlin Fine Chemicals: Review Dec 2009 Quaterly Results


Camlin fine Chemicals has published the Unaudited Dec 2009 Quaterly results. Following are some of the salient points.
Dec 2009 (Dec 2008) in Lacs
Gross Sales :                3436.67 (2291.36)   - UP   49.98%
Profit from Operations:   237.68   (187.29)   - UP   26.90%
Profit Before Tax:           141.31     (57.66)   - UP 145.00%
Tax :                                96.42     (18.44)   - UP 422.90%
Net Profit:                        44.89     (39.22)   - UP   14.45%
===========================
As can be seen topline growth is approximately 50% bottomline growth is 14.5% and taxes have increased by 423%. The sharp increase in taxes has skewed the bottomline. Profit before taxes was 145% which is much better than the topline growth of 50%.

Let us also look at margins with respect to sales.

1. Profit from operations as a percentage of sales has reduced from 8.39% (Dec2008) to 7.13% (Dec 2009) which is because of increase in expenses from 91.61% (Dec 2008) to 92.87% (Dec 2009).
- If we look at 9 months figures we can see that the expenses are down from 89.55% (Nine months ended Dec 2008) to 89.42% (Nine Months Ended Dec 2009).
- We can hereby conclude that the expenditure/Costs have been increasing at a higher level and have accelerated in the last Dec 2009 quarter. The overall costs are still below the Annual March 2009 numbers (89.76%)

2. Other Income has increased substancially from 0.87% (Dec 2008) to 1.35% (Dec 2009) since it is a small component of total sales the Profit before Interest & Exceptional Item has improved (8.48%) but still below Dec 2008 (8.98%) levels

3. Interest payments have dropped by 240bps from 6.67% (Dec 2008) to 4.24% (Dec 2009). The govt Low interest rate regime has definitely helped the company in increasing profits which can be seen in a 220 bps increase in Profit After Interest but before exceptional items.
- One must remember Dec 2008 was the peak of the financial/credit collapse so 6.67% of sales can be considered as a high water mark for interest payment ratio.

4.  Sharp increase in taxes paid from 0.83% (Dec 2008) to 2.89% (Dec 2009). This increase in taxes has reduced the profit after tax numbers. Which should have been much higher ideally.

Conclusion: Camlin Fine Chemicals has a topline growth of close to 20% (Nine months) and can be expected to reports 120Cr of topine for year ended March 2010. Looking at the increase in expenditure cost of 120bps, costs have to be contained in the future. End of low interest regime with the hike in CRR signals that cost management and cash flow management is going to be critical for a sustained growth in topline and bottomline.
- Companies plan to have a rights issue soon would help reduce the risks of interest rate hike.
- The high level of tax payment considering that fact that the company was expecting Export Oriented Unit (EOU) status for its plant could signal that the profit growth is being tempered down to reflect a more consistent sequential number. This might also help in pricing the rights issue for the company by reporting higher sequential profits.
- Investment can be considered at this level (CMP: 92.60 Market Cap: 53.81Cr) for a long term basis(2+ years). The company has strong promoter group interest, low instittutional holding, listing only in BSE and fair valuations for a market leader. Ideally the stock would be valued at a market cap close to 1 times sales.  

Tuesday, January 12, 2010

Dark Horse: Regency Ceramics


These are "Penny Stocks" with potential of upside and downside. Unlike true penny stocks Regency Ceramics is an established company of 25 year history which is reporting losses and hence available at a discount. Here is the story:

Regency Ceramics:  Listed in BSE and NSE.
CMP: 10.05 
Market Cap: 13.32Cr
Sales TTM(12 Trailing Months): 159.99Cr
Debt March 2009: 137.31Cr
Operating Profit TTM: 0.15Cr
Gross Profit TTM: 5.12Cr
Interest TTM:13.22Cr

Promoters have recently (Dec 2009) converted 15.89Cr of unsecured loans by the promoter to Regency Ceramics into Equity resulting in additional equity of 1.28Cr shares of 10Rs each.
With the increase in paid up capital to 26.44Cr from 13.59Cr.  Promoter shareholding has increased to 72.22% (19.09Cr of Equity)
The price at which new equity is issued to promoters is 12.37 per share.
Promoters have converted 15.89Cr of interest bearing loans to equity at 12.37 per share (as per the Scheme of Arrangement)
Right right now you can buy the stock from the market at approximately 25% discount to the promoter buy price.

The other points worth consideration regarding March 2009 numbers.

- Secured Debt of 115Cr
- Unsecured Debt: 21.7Cr (15.89Cr to be converted into Equity)
- Net Current Assets: 50Cr (Market Cap is just 26.44Cr considering conversion of debt to equity of 15.89Cr)
- Inventories 32Cr
- Cash and Bank balances: 12.48Cr

- Company in the good old days March 2006, March 2005 reported other income of 4.5Cr & 4.89Cr respectively which included 1.4Cr amd 1.55Cr of lease rental income. Regency Ceramics had operating profits of 18Cr
- Regency Ceramics is one of the largest Ceramic tile manufacturer in India. It has a gas based ceramic tile manufacturing plant with capacity of  250,000MT per annum
- Regency ceramics also merged an entity called Regma Ceramics which produces valued added large dimension tiles and with a capacity of 100,000 MT per annum which would increase its tile manufacturing capacity to 350,000MT per annum.
- Year 2004 and 2005 Regency Ceramics was a divident paying company with divident payout of 15% Rs 1.5 per share with share price ranging around  Rs 30 - 35/=.
- The company was also the largest Ceramic Tile manufacturer in India with a Gas Based Plant with supplies from KG Basin by Gail. With the large amount of gas being discovered in KG basin production of ceramic tiles at 100% capacity should not be a problem. Current Capacity utilization would be around 60% so we can expect a topline growth of 70% with capacity utilization of close to 100%
- Regency Ceramics is reporting losses in March 2008 but receives special award in recognition of outstanding export performance for the year 2007-2008 from the Ministry of Commerce (CAPEXIL) Govt of India.


I personally think this (10/=) is a great price to get into the stock and 1-2 years down the line Regency will be a 15% divident paying company with stock price around atleast 30-40 Rs per share. Might as well hold on to the stock as the promoters do give out generous dividents.

Company Website Link

Wednesday, December 30, 2009

Gujarat Ambuja Exports


August 30,2011:GAEL: Promoters buy 10,000 shares from Market @ 23.08 on August 26,2011
August 30,2011: GAEL: 1MW Bio Gas Plant in Uttarakhand (Maize Starch waste)
August 30,2011: GAEL: 1MW BioGas Plant in Himmatnagar (maize starch waste)
August 27,2011: Gujarat Ambuja Exports: June 2011 Quarterly Result Review
August 16,2011: Gujarat Ambuja Exports: Ready Steady GO!!
July 18,2011: Gujarat Ambuja Exports: Year End March 2011: Review
May 21, 2011: Gujarat Ambuja Exports: MoneySights Rating: Strong Financials, Strong Upside
May 21,2011: Gujarat Ambuja Exports: Foreign Funds invested in Gujarat Ambuja Exports
April 14,2011: Gujarat Ambuja Exports: March 2011 Shareholding data
March 7,2011: Gujarat Ambuja Exports: HSBC Mutual fund buying into GAEL
Feb 8,2010: Gujarat Ambuja Exports: Company Product Video and Client List (Very Very Important)
Feb 2,2011: Gujarat Ambuja Exports: Dec 31,2010 Quarterly Results Segmented Data
Feb 1,2011: Gujarat Ambuja Exports: Dec 31,2011 Quarterly Results Review
Jan 14,2010: Gujarat Ambuja Exports: CRISIL Rating upgrade Jan 2011
Jan 14,2010: Gujarat Ambuja Exports: Dec 31,2010 shareholding review
Dec 1,2010: Gujarat Ambuja Exports: Dalal Street Journal Article
Oct 25,2010: Gujarat Ambuja Exports: Promoter Guidance for Year 2011
Oct 25,2010: Gujarat Ambuja Exports: Sept 2010 Quarterly Result Review
Oct 14,2010: Gujarat Ambuja Exports: Sept 2010 Shareholding Report
Oct 12,2010: Gujarat Ambuja Exports: Sept 2010 Qtrly results on Oct 23,2010
Sept 26,2010: Gujarat Ambuja Exports: Hold on to your cheap stocks
August 31,2010: Gujarat Ambuja Exports: Promoters buy 53,506 shares in August 2010: Annual Report 2010
August 13,2010: Gujarat Ambuja Exports: Promoter Buying SAST Disclosure August 10-11, 2010
August 4,2010: Gujarat Ambuja Exports: June 2010 Quarterly Result Review: Strong Buy!
July 17,2010: Gujarat Ambuja Exports: Announcement: Strong Buy!!
July 14,2010: Gujarat Ambuja Exports: Review: Shareholding as of June 2010
June 7,2010: Gujarat Ambuja Exports: Promoter buying from Open Market Jun 1,2010
April 28,2010: Gujarat Ambuja Exports: March 2010 Quaterly and Annual Result review
April23, 2010: Gujarat Ambuja Exports: What is the Ideal price for GAEL
April 16, 2010:Gujarat Ambuja Exports: Sharebuyback Jan 15,2008 Avg Price 34.26
April 14,2010: Gujarat Ambuja Exports: Review
June 01,2009: Gujarat Ambuja Exports: Deep Value
Dec 25,2009:  Best Value Buy
Gujarat Ambuja Exports - Website (updated)
Annual Report March 2009 (updated)
Annual Report March 2010
Annual Report March 2011 (New Link)

Tuesday, December 29, 2009

Pitti Laminations: Deep Discount: Indirect Power Play


Pitti Laminations:
CMP: 34 Listed on: BSE/NSE
Market Cap: 32.22Cr Sales: 267Cr (March 2009) Pitti Home Page

Pitti Laminations manufactures electric grade steel stampings and laminations up to a diameter of 1300 mm (51”) for application in Industrial motors, DC Machines, Alternators, Traction Motors, Pumps, Train lighting generators, Aeronautics, Medical diagnostics equipments, Windmill generators, Laminations for specialised applications, Die-Cast Rotors, Assembled Stators and Built-up Rotors.
Company has increased its manufacturing capacity from 10,000MT to 25,000MT.
It has a large customer base in India and abroad like ABB, BHEL, Siemens, Crompton Greaves, Areva T&D, VATECH, Bharat Bijlee, Kirloskar Brothers, Suzlon, GE(US), KSB Pumps, Otis Elevator Company, Toyo Denki Power Systems, Welco Technologies(US), DOL Motors Private Limited, PILLER Power Systems, Wittur, DK Rewinds.
Pitti Laminations has also set up value added facbricated steel Stator Body capacity of 3000 Nos per annum.


 Current Market cap is 0.11 times its March 2009 sales. Pitti laminations however has been impacted by the economic slowdown and sales for the Twelve Trailing Months (TTM) is close to 201.22Cr which is a drop of 20%+  in topline and bottomline of 4.6Cr (25% drop). The stock however seems to have bottomed out and is available close to its 200Day EMA. Divident payout is 10% but the avg divident payout for the past 5 years is 17% (Rs 1.7 per share) which is 5% divident payout for CMP.


Recommendations:  Strong buy at these levels since Pitti Laminations is an indirect play on the power infrastructure story of India. Divident return is also a healthy 2.9% (10% divident) but long term divident return is 5% which is great.

Strategy: Buy now at these levels and with improved fundamentals in next year we can expect it to be a multibagger.

Gammon: Bridge Collapse Accumulate


Just look at the accumulation happening at 220 for Gammon 1st trading day after bridge collapse.
NHAI has given a clean chit to GAMMON.

GAMMON has built the maximum number of bridges in India. Gateway of India has been built by Gammon and here you have the company selling at 0.5 times sales!! STRONG Buy


Saturday, December 26, 2009

Update Venkys India


Venkys India: CMP: 239 Market Cap: 224.46Cr
52 Week High : 285 52 Week Low: 65


Venkys India has recently scaled its new 52 Week high (285). The question in our mind is:
1. Do you continue to hold?
2. Is this a good price to buy?


Suggestion: Venkys is still a fundamentally good story.

- It's market capitalisation is still 0.5 times sales probably because of its "Non Vegetarian" outlook. Company is not in a commodity business as people think. It provides value added inputs to hatcheries by providing chicks, broiler and layers, Poultry feed, Poultry Vaccines, Health Food Supplements,
- Promoters have been buying from the open market at prices of 140-160 levels. Promoters would expect more than 200% appreciation in long term.
- Venkys India has close to 54Cr invested in mutual funds and has 10Cr worth of Cash and Cash equivalent and generated 6 Cr of other income (last year 5.22Cr)
- Inventories worth 70Cr

Current Worth = Market Cap + Debt - (Cash + cash equivalents)
Current Worth = 224.46 + 93.89  - 64  =  254.35Cr
Total income Twelve Trailing Months = 634.83Cr

Tyson one of the largest players in the world in processed chicken has tied up with Godrej. Venkys has been avoiding direct entry into the local fresh chicken broiler market but with entry of players like Tyson, Venkys has to decide what is it future growth strategy.
Venkys also has SPF (Specific Pathogen Free) Egg capacity. Serum institute of India one of the largest Vaccine manufacturer in the World has 1% stake in Venkys.

Technically there will be a drop in the stock price, it would be good to accumulate stock slowly in venkys around 170-200 levels (close to promoter buying level) Holders who have bought at lower levels can book some profit at these levels.
Stocks generally over shoot both on upside and downside. We have not yet heard of any positive news flow with regards to Venkys (which is when its best to sell the stock)
Decision: Hold, as further gains should be there in this stock. Investors with holdings at lower levels in large quantities could sell 30-40% stake to reduce their cost of holding to close to zero.  It also will provide you the cushion to buy more at dips. More buying should be done at close to 170-200 levels. Investments can also be done on Best Buy recommendations

PN: These are my personal views please do your own deep dive before investing.

Venkys India

June 14,2010: Update: Venkys March 2010 Result Review:Hold
Dec 25,2009: Update Venkys India.
May 29,2009:Venkys India: Chicken King of India

Friday, December 25, 2009

Best Value Buy:


Current Best Value Buy according to me is "Gujarat Ambuja Exports" (Dec 25,2009) and here are the reasons.

CMP: 23, Market Capitalization: 317.52Cr
1. Company buyback in 2008 avg price 34.5 per share buyback worth 3.31Cr.
2. As per SEBI Guidelines buyback can be done with only 10% of free reserves so GAEL had 331Cr of free reserves in 2007-2008. current market cap is 317Cr
3. Promoters have been increasing stake by buying stock from the market.
4. Promoters have bought 1,98,256 shares from Jan 2009 to June 2009. Price range is 13 to 36 for the period Jan 2009 to June 2009.
5. Current Market Capitalization (317Cr) is close to all time lows for past 4 years (2006-2009 Avg Lowest Market Cap: 270.48Cr)

I would advise strong buy with 50% growth potential (Market Cap: 475Cr) from these levels in the next 6-12 months timeframe. 1-2 year target is 100% appreciation ie. 634Cr


Camlin Fine Chemicals: Long Term Value


Camlin Fine Chemicals. BSE: 532834
Current Market Price: Rs 102
Market Capitalization: 59.22Cr
Sales March 2009: 100Cr,  ROCE: 19.02,  Total Debt: 26.2Cr

This is a stock I have been recommending for quite some time (when it was in mid 50). It has run up sharply and is now close to its lifetime highs. We are right now in crossroads, Buy/Sell/Hold the company stock.
Camlin Fine Chemicals (CFC) is an offshoot of Camlin a well established stationary and art brand in India from 1931.  CFC came into existence when the promoters of Camlin were looking for new areas to growth beyond their stationary business. Fine chemicals/Active Pharma Ingredients (API) was identified as future growth area (Two decades back). CFC growth started when Ashish Dhandekar took over responsibilites of the Fine Chemical division of Camlin. With CFC becoming a stable business it was seperated from the parent company on Dec 22, 2006 with majority control to Ashish.

CFC is defined as leading manufacturer & exporter of Bulk Drugs, Fine Chemicals and Food Grade products. It has established itself as 2nd largest manufacturer in the world of food grade antioxidants TBHQ & BHA with 70% market share in India.

Since its inception as an independent company in Dec 2006 the company has made forays into Sucralose, neutrachemicals Glucosamine through acquisition of Sangam laboratories, Speciality chemicals through Chemolutions Chemicals Ltd, Renewable Energy and Consumer durables with Fine Brands. Company has recently announced approval of rights issue.

Suggestion:  Promoters have made acquisitions at price close to Rs 80 when the company was established as an independent entity (Link). Company is still in its infancy considering the fact that it was established as an independent firm on dec 2006. Company is trying to increase its business areas by entering into Neutrachemicals, Renewable Energy, Consumer Durables all this will require time to settle and businesses to be profitable. I would advise reduction in holding as market cap. approaches close to 75Cr or when rights issue date is announced. 
Dilution in Return on Capital:
- Additional raising of capital
- Foray into new areas like consumer goods (Fine Lifestyle Brands)
- Renewable Energy & specialized chemical (Chemolutions Chemicals Limited)

Long Term Value: Considering the strong promoter's it would however be advisable to hold some stock and accumulate more at lower levels (below 75Cr Market Cap)  in the next few years as a long term value proposition.

Monday, June 01, 2009

Gujarat Ambuja Exports: BSE: GAEL : Deep Value


Gujarat Ambuja Exports:

BSE Symbol: GAEL

NSE Symbol: GAEL

CMP: 28.70 Market Cap: 397.76Cr (3977.6 million) Sales TTM = 1631.53Cr (16315.3million)

Gujarat Ambuja Exports is an agro processing company producing value added products for export.

- Company has recently (March 27,2008) set up a 500 tonne per day (364x 500 = 182,000 tonnes per annum) maize processing plant. The processing plant is going to produce value added products such as Sorbitol, Dextrose, Starch, Liquid glucose, Malto dextrine. 2nd largest capacity in India.

- GAEL initiated a buyback of shares at Rs 38 per share and bought back 966,615 shares till Jan 15,2008.
- Company has forex hedging losses in its books worth 32.7Cr as of march 2009.
- Company shares are of face value Rs 2 and divident payout is going to be40% ie 80paisa per share.
- 5.63 % shares (7,791,034) held by Quantum M Ltd as per March 2009.
- 4.25% shares (5,877,060) held by Reliance Growth fund as per March 2009.

GAEL is worth investing at these prices and one can expect a price of about 80 to 100 in 12 to 24 months time frame.